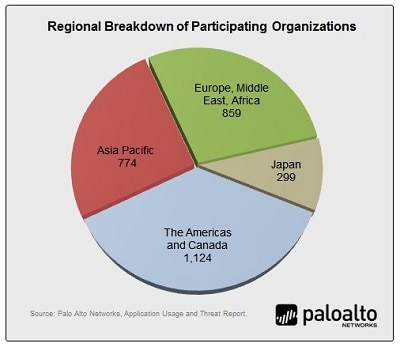
In the music world, variations on a theme is loosely defined as, “material repeated but in an altered form.” This is an apt description of the regional findings from the latest Application Usage and Threat Report published a few weeks ago. There are regional differences when compared to the global dataset, but they are very subtle, a fact that can be partially attributed to the size of the sample. The data encompasses more than 3,000 networks (regional breakdown shown in the graphic below) where we analyzed 1,395 applications consuming 12.6 petabytes of bandwidth and more than 5,000 unique threats generating 260 million associated logs.
Sharing applications: commonly found, high in bandwidth consumption, low in threat log volume.
- The number of common sharing applications found in each region varied from a 274 in Japan (29% of total) to 320 found in Americas/Canada (24%) and Europe/Middle East/Africa (25%).
- The percentage of bandwidth consumed varied more dramatically with Japan consuming the least at 15% and Asia Pacific the most at 27%. In every region, the filesharing category had the highest number of variants with BitTorrent and FTP consuming the highest volume of bandwidth across the board.
- Facebook continues to dominate the social media segment, consuming as much as 83% of the social media bandwidth (Asia Pacific). The only exception was in Japan, where Facebook consumed only 56% of the social media bandwidth and Twitter consumed 27% - nearly three times as much as any other region.
- The percentage of threat logs viewed varied from 0.2% in both Americas/Canada and Europe/Middle East/Africa to a high of 1% in Asia Pacific. Interestingly, exploits, not malware was the common threat type found with FTP and WebDAV the most heavily targeted. The most significant regional exception was in Asia Pacific where a cross-site scripting exploit in Facebook-apps represented a significant number of threat logs.
Business applications: universally targeted by vulnerability exploits*.
- Across all regions, more than 66% of the application vulnerability exploit threat logs were found in less than 10 applications, nearly all of which are infrastructure or business critical in nature. SQL, SMB RPC, SIP, and Active Directory are just a few of the business applications that fell into this group of applications. The high volume of threat logs found in this segment of applications implies that cyber criminals have their eye on the prize: the data center applications that house an organizations most valuable assets.
- Americas and Canada: eight business applications represented 91% of all exploit logs observed with MS-SQL and MS-RPC making up more than half of the exploit logs found (54%).
- Europe/Middle East and Africa: eight business applications represented 68% of the exploit logs with MS-RPC and MS-SQL-monitor delivering 36% respectively.
- Asia/Pacific: seven out of the top nine applications represented 86% of the exploit logs observed, the majority of which targeted MS-SQL and MS-RPC (62%).
- Japan: five business applications represented 87% of the exploit logs with MS-RPC and MS-SMB the two most heavily targeted (85%).
Malware*: small in transaction size, high in volume, adept at hiding.
- Nearly 100% of the malware logs observed were found universally in six or fewer applications; the highest volume of malware logs observed were in UDP-based applications such as DNS or custom-unknown UDP.
- Comparatively speaking, the number of unique malware instances was 80% smaller than the number of unique exploits, yet malware generated a significantly higher volume of logs, outnumbering exploit logs by a 3:1 ratio, on average.
- Americas and Canada: five applications represented 99.99% of the malware logs with custom-unknown UDP and web-browsing accounting for 94% and DNS an additional 6%. The Americas/Canada was the only region where DNS was not in the top two highest volume.
- Europe/Middle East/Africa: custom-unknown UDP delivered 74% of the malware logs found and DNS represented another 21%.
- Asia/Pacific: four applications were required to deliver 99% of the malware logs ofund with custom-unknown UDP making up 45% and DNS another 25%.
- Japan: six applications represented 99% of the malware logs observed with DNS and custom-unknown UDP accounting for 45% and 52% respectively. Japan was the only region where DNS delivered the highest volume malware logs.
The Application Usage and Threat Report is the first analysis of its kind to map threat activity to applications and the findings cast doubt on common perceptions that sharing applications represent all of the risks; it confirms what most security practitioners already knew – their business applications being targeted; and it sheds light on the most common mechanism used by malware to evade detection – hiding in plain sight.
See for yourself:
- Get the full report here.
- Review the regional findings here.
- Interactively browse all of the data here.
*The threat logs observed are broken out into vulnerability exploits (e.g., code execution, SQL injection, overflows) and malware (e.g., botnets, spyware, keyloggers).
